目的
1.IOTデバイス?のOmron 環境センサ(2jcie-bl01)で取得した値をGrafanaを使用して可視化を行う
2.Grafanaのアラート機能からSlackAPIを使用しSlackへアラート通知を使って行う。
※elasticsearchやfluentd等の設定は、とりあえず動いた設定のみ。
接続イメージ

物理構成

※線の色:各ネットワークセグメント
準備
・オムロン環境センサー (2JCIE-BL01)
・BLE受信端末(ubuntu , Raspberry Pi 等)
・サーバー (Fluentd / elasticsearc / grafana)
-> grafanaでelasticsearchの情報が可視化ができる状態となっている。
・slack (アラート表示用のチャンネル作成要)
参考情報
サンプルプログラム
センサー値の取得とfluentdとの接続に関しては、オムロンがサンプルプログラムを公開しているものを環境に合わせて修正し使用する
Sensorから送られてくる情報
手順
1.fluentdの設定
Sensorから送られてくるデータ(JSONフォーマット)をFluentdに取り込むために設定を行う。
■設定内容
ポート番号:24224はサンプルプログラムで使用していたポート番号のため
修正する場合は、サンプルプログラムの修正が必要
[root@fluentd td-agent]# cat td-agent.conf
<source>
 @type forward
 @id bl01.Sensor.log
 port 24224             ※サンプルプログラムに合わせて設定
</source>
<match bl01.**>
 @type elasticsearch
 host 172.16.100.211   ※elasticsearchのサーバを指定
 port 9200
 logstash_format true
 logstash_prefix sensor ※Index名の頭文字?を設定
 type_name sensorlog
</match>
[root@fluentd td-agent]#
※上記設定でElasticsearchに登録させたインデックス名
[root@es01 ~]# curl 'localhost:9200/_cat/indices?v'
health status index uuid pri rep docs.count docs.deleted store.size pri.store.size
yellow open sensor-2019.01.15 goxebPQUSq-uotw-c0e7Zw 5 1 157 0 331.3kb 331.3kb
yellow open sensor-2019.01.13 QyEi6axbQHGMEKoNrq_Wwg 5 1 87 0 237.3kb 237.3kb
green open .kibana_1 PMd3vvOuRp6Zqn1vtXg5VQ 1 0 5 0 22.7kb 22.7kb
yellow open sensor-2019.01.14 sBI7jmxrTtCNGNLY0hpBHQ 5 1 279 0 414.8kb 414.8kb
※ health がyellowとなっている原因はよくわからない
2.BLE受信端末の設定
2JCIE-BL01に設定するモードやBLEに関する設定は、詳しく説明しているサイトを参照してください。
サンプルプログラムの取得や環境構築の手順は以下のgitを参考とする
https://github.com/OmronMicroDevices/envsensor-observer-py
サンプルプログラムの取得
user@user:~$ sudo apt-get install git
user@user:~$ sudo git clone https://github.com/OmronMicroDevices/envsensor-observer-py.git
プログラムディレクトリに移動
user@user:~$ cd envsensor-observer-py/envsensor-observer-py/
user@user:~/envsensor-observer-py/envsensor-observer-py$
log ディレクトリ作成
user@user:~/envsensor-observer-py/envsensor-observer-py$ mkdir log
Config.pyの修正
csv出力とfluentdのみ trueとする。INFLUXDBはFalseとする。
user@user:~/envsensor-observer-py/envsensor-observer-py$ cat conf.py
# csv output to local file system
CSV_OUTPUT = True

~省略~

# use fluentd forwarder
FLUENTD_FORWARD = True
# fluent-logger-python
FLUENTD_TAG = "bl01" # enter "tag" name
FLUENTD_ADDRESS = "10.0.0.100" # enter "localhost" or IP address of remote fluentd
FLUENTD_PORT = 24224 # enter port number of fluent daemon

# fluent-plugin-influxdb (when using influxDB through fluentd.)
FLUENTD_INFLUXDB = False

~省略~

# uploading data to the cloud (required influxDB 0.9 or higher)
INFLUXDB_OUTPUT = False

~省略~
実行
user@user:~/envsensor-observer-py/envsensor-observer-py$ sudo ./envsensor_observer.py
※今回の評価環境ではデータ取得は出来たが途中で終了してしまう場合がある、設定が足りないのか?環境に合わせてソースコード修正が必要なのか??
他のソフトでBLEスキャンが実行されるとエラーで止まるよな感じだが原因がよくわからない。。
user@user:~/envsensor-observer-py/envsensor-observer-py$ sudo ./envsensor_observer.py
[sudo] user のパスワード:
envsensor_observer : complete initialization

Exception: EVT_CMD_COMPLETE
Traceback (most recent call last):
 File "./envsensor_observer.py", line 381, in <module>
 parse_events(sock)
 File "./envsensor_observer.py", line 86, in parse_events
 parsed_packet = ble.hci_le_parse_response_packet(pkt)
 File "/home/user/envsensor-observer-py/envsensor-observer-py/ble.py", line 284, in hci_le_parse_response_packet
 raise NotImplementedError("EVT_CMD_COMPLETE")
NotImplementedError: EVT_CMD_COMPLETE
Exit
user@user:~/envsensor-observer-py/envsensor-observer-py$
■取得したデータログ
user@user:~/envsensor-observer-py/envsensor-observer-py$ cat env_sensor_log.csv
Time,Gateway,Address,Type,RSSI (dBm),Distance (m),Sequence No.,Battery (mV),Temperature (degC),Humidity (%%RH),Light (lx),UV Index,Pressure (hPa),Noise (dB),Discomfort Index,Heat Stroke Risk,Accel.X (mg),Accel.Y (mg),Accel.X (mg),eTVOC (ppb),eCO2 (ppm),SI (kine),PGA (gal),Seismic Intensity,Vibration Info
2019-01-14 23:30:07.842421,user,〇〇※MACあどれす※〇〇,IM,-70,2.72526054962,13,2940.0,22.44,29.38,38,0.02,1009.6,40.68,66.80200328,16.5357893445,-1017.0,5.8,-1.9,0.0,0.0,0.0,0.0,0.0,-
■正常時の表示例(止めるまで連続で表示される)
# ./envsensor_observer.py
envsensor_observer : complete initialization

----------------------------------------------------
sensor status : 2019-01-28 00:23:48.641200 (Intvl. 60sec)
 DC■□■□■□■□AD : IM : ACTIVE (2019-01-22 00:23:48.590487)

----------------------------------------------------
sensor status : 2019-01-28 00:24:48.641019 (Intvl. 60sec)
 DC■□■□■□■□AD : IM : ACTIVE (2019-01-22 00:24:40.064434)

----------------------------------------------------
sensor status : 2019-01-28 00:25:48.653527 (Intvl. 60sec)
 DC■□■□■□■□AD : IM : ACTIVE (2019-01-22 00:25:48.442352)
  ・
  ・
  ・
3.grafanaでの可視化
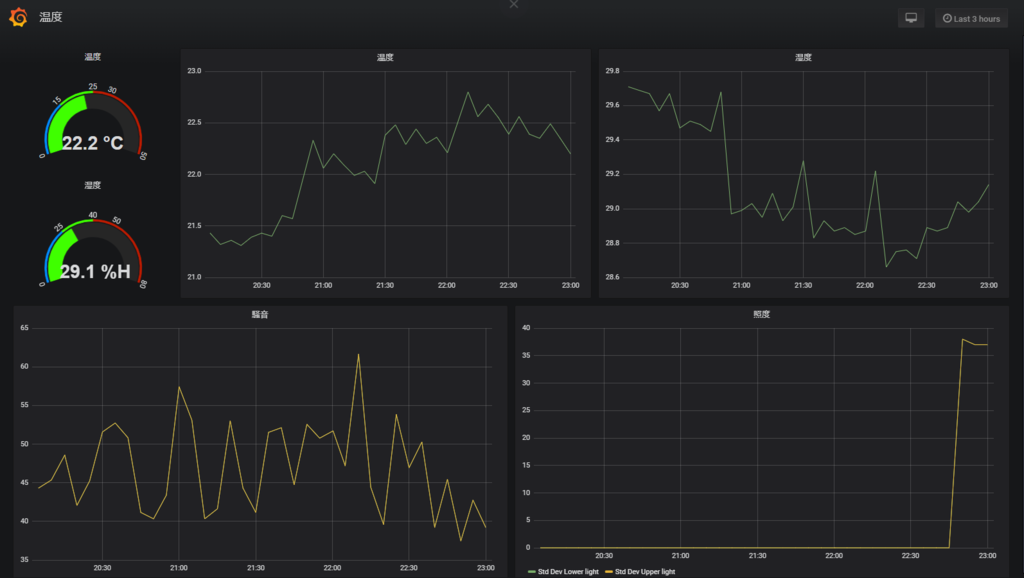
取得したセンサー値の温度、湿度、騒音、照度のみをグラフ化した。
4.slack接続用のtoken/Incoming Webhooks用URL生成
トークン取得
Slack API 推奨Tokenについて - Qiita を参考に実施
※トークン作成用サイト
Incoming Webhooks用URL生成
SlackのWebhook URL取得手順 - Qiita を参考に実施
※Incoming Webhooks用URL生成用サイト
https://slack.com/services/new/incoming-webhook
5.grafanaでのアラート設定(Slack通知)
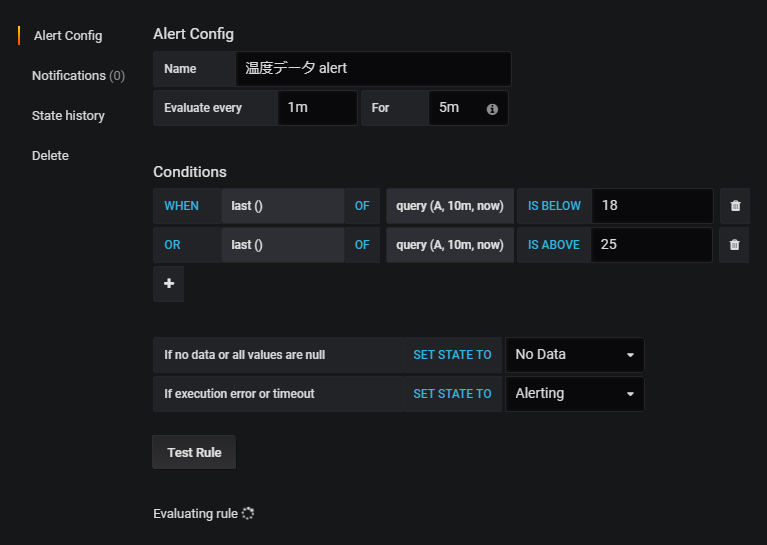
アラート条件
1.一定の温度以上なるとslackに通知
2.一定の温度以下になるとslackに通知
Slack通知用設定の登録
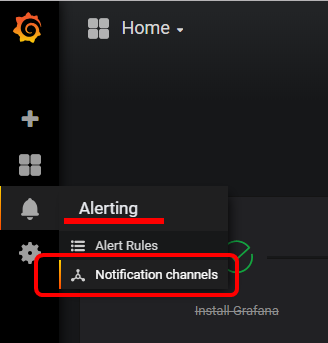
1) [Alerting] -> [Notification channels]を選択
2) [+New Channel]から新規作成

3) Type: [Slack]を選択し、上記手順で取得したURLとトークンを入力する。
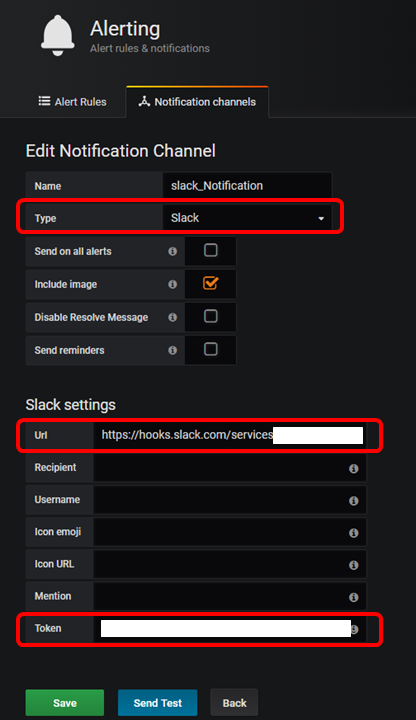
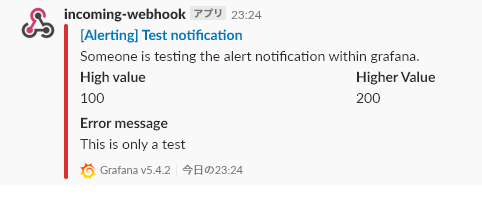
4)[SendTest]を選択して、Slackに通知が飛ぶことを確認し、[Save]する。
※通知されるメッセージ
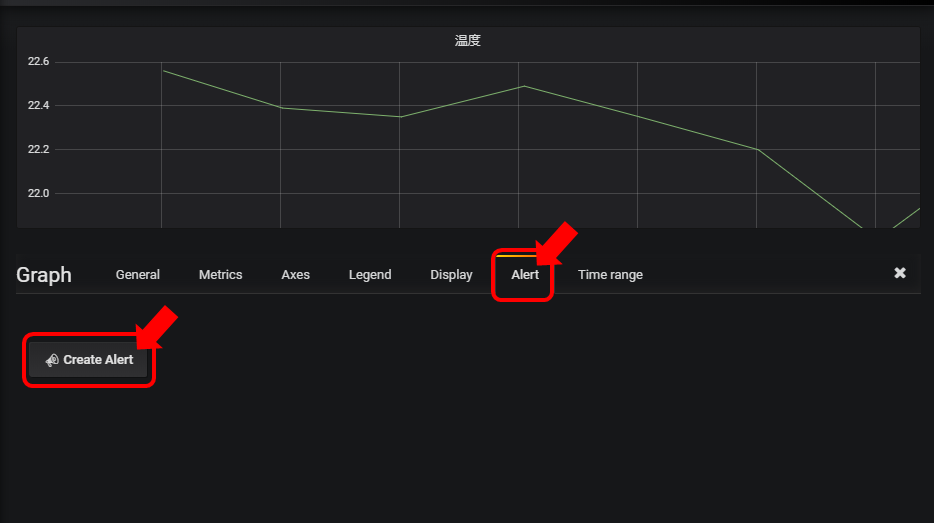
グラフにアラート設定登録
1) グラフのEdit画面から Alertタブを選択し、[Create Alert]を選択する
2)アラート条件の入力
3)[Notifications]から通知条件を作成したSlack通知を設定します。
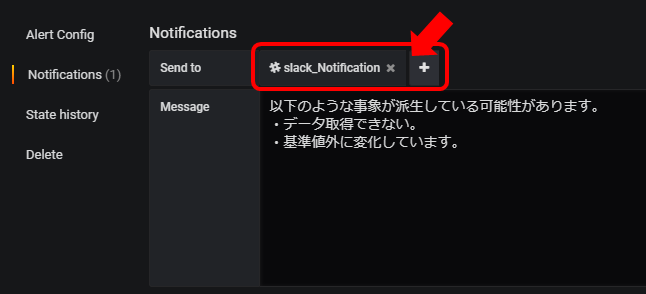
設定を保存して完了
確認
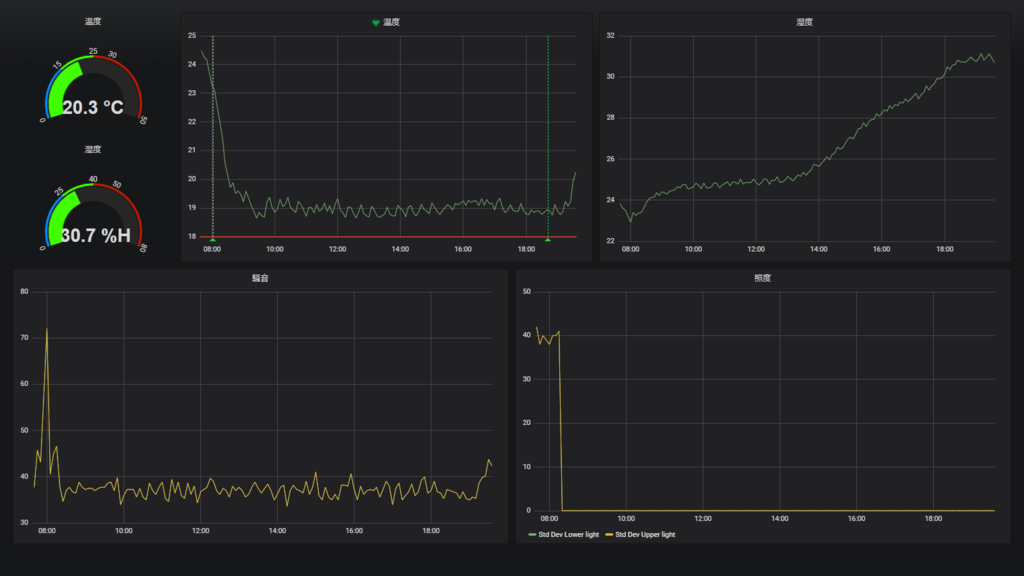
※温度のグラフで❤がグラフ名についていることが確認でき、アラート条件を満たすとグラフ上に縦線が引かれることが分かる。
※アラートに一致したときの確認できるGrafana上のログ
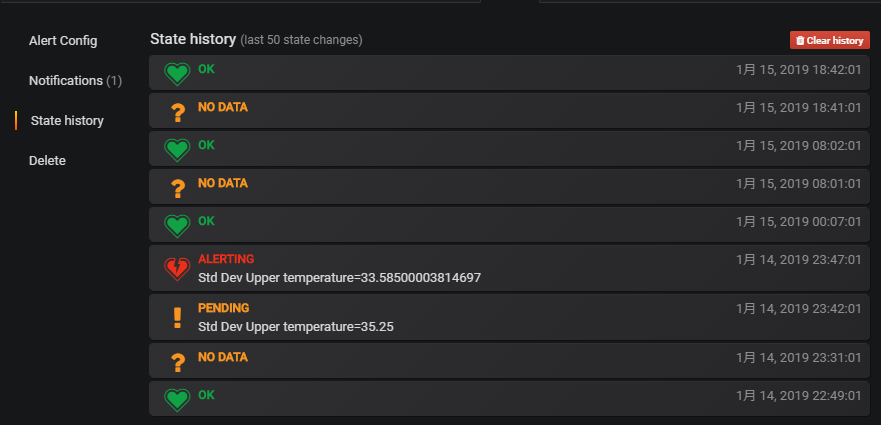
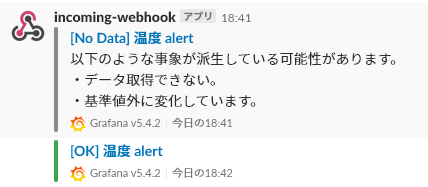
※Slackに通知されたメッセージ
